What's New in Version 17
Software available to download here - Visit the TC2000 YouTube channel

Software available to download here - Visit the TC2000 YouTube channel
Long Iron Condors and Short Iron Condors have reversed definitions.
Short Iron Condor = Expect less volatility
Long Iron Condor = Expect more volatility
*All securities are offered through TC2000 Brokerage, Inc., Member FINRA/SIPC. TC2000 Brokerage, Inc. and Worden Brothers, Inc. are separate companies affiliated through common ownership. Trade stocks for only $4.95, trade options for 65 cents per contract plus $2.95 base.

Access scaling buttons (A L S%) on bottom right corner of chart.
Click S% to turn on smart scaling. This makes the scaling grid a constant size as you go from chart to chart. Spacebar through your charts so that you can see how the grid lines remain fixed in the same place as you step through stocks. This lets you compare stocks on an apples-to-apples scale.
The red number in the bottom right corner of the chart represents the distance between grid lines. This makes it easy to approximate a stock's percent move by the number of grid lines it crosses. If stock ABC crosses 3 grid lines while stock DEF crosses 6 grid lines, you know that DEF went up twice as much.
When you change time frames or zoom, smart scaling will automatically recalculate a new grid. You'll see the red number change in the lower right. You might notice that some stocks get flat on smart scale while some go off your computer screen. That's because the smart scale will represent the true volatility of each stock helping you to identify trend strength and risk.
If you are bothered because too many stocks appear too flat or too volatile, you can adjust the baseline smart scale factor. Simply click on the red number in the lower right and use your mouse wheel to change the factor between 1 and 99. The higher the number, the flatter the charts will appear on average.
Cool Tip: Right click on chart and select properties. Select the comparisons tab. Overlay your favorite market index (such as SP-500). Uncheck the box "Start all plots at same point." Make sure smart scaling is on. As you spacebar through your charts, the index remains fixed giving you a great relative reference. It really helps you see how each stock moves relative to the market.

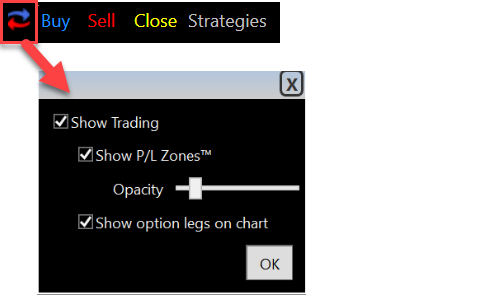
Access the new trading menus on the lower left corner of any chart. They give you access to most common order tickets and operations.
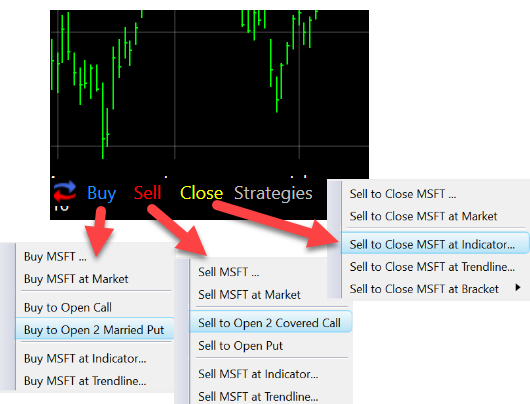
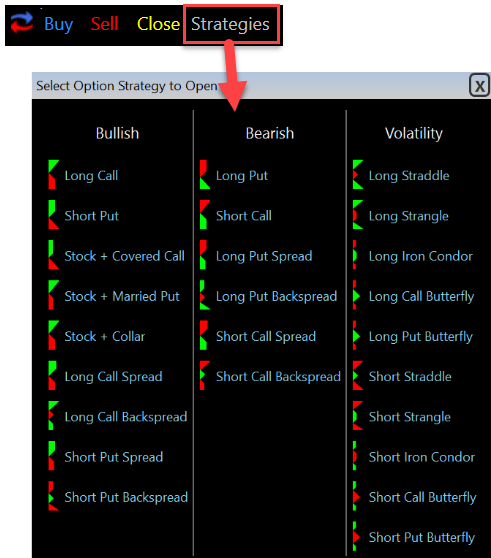
Use the Strategies button in the lower left of a chart to open option strategy tickets directly on the chart. The menu divides strategies into bullish, bearish and volatility categories. Strategies include single-leg, multi-leg and combinations with underlying stock. Calendar strategies are still being worked on. They'll be available soon.
Multi-leg strategies open as a single trading ticket on the chart.
This example shows an order ticket for a call option.
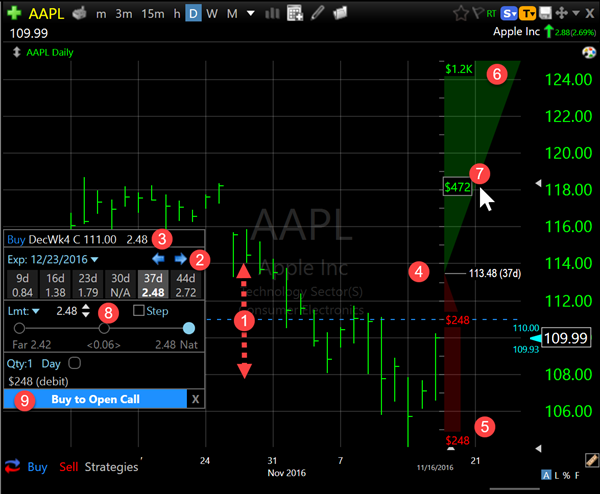
This is an example of buying a CALL option. Watch the P/L zones and breakeven point dynamically update during the following operations:
At the end of the video, the mouse hover shows the value of the green zone at different stock prices. The P/L zones are calculated based on the expiration date of the option contract(s) being viewed.
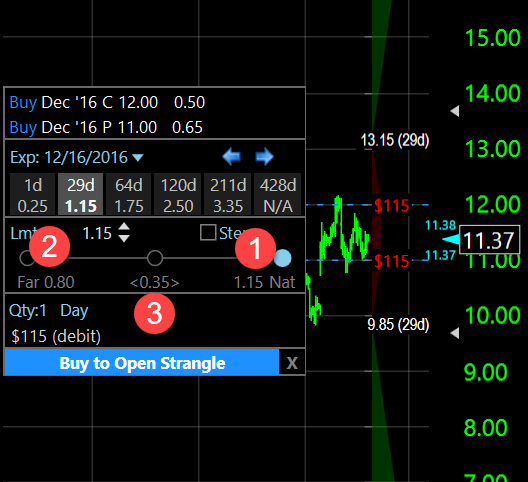
With multi-leg strategies, drag each contracts line separately to select the strike prices. The P/L zones update dynamically for the selected strategy. In the short strangle strategy, you are hoping for the underlying stock price to remain between the two strike prices through expiration. This strategy has unlimited risk to the upside and downside.
Options and multi-leg strategies can have large spreads. The slider lets you set the limit anywhere from the far to the natural (marketable price).
The Step Limit lets you start your order at the far side or middle of the spread and slowly step toward the natural price. You could do this manually by placing your order and manually replacing your limit price, but the step limit does it automatically for you. This lets your order be exposed to the market to see if anybody wants to take the other side of your position at a better price for you.
The disadvantage of stepping toward the natural (and/or market price) is that if the market moves against you while stepping, you will get a worse price than if you had just bought at the market initially.
You can access these new cloud tools at www.TC2000.com/cloud.
The heat maps can be displayed on a mobile device or in your browser. They show any watchlist or portfolio organized by sectors and colored by performance or volume buzz. Click (or touch) on a symbol in a heatmap to change the active symbol in your TC2000 software. You can use your tablet or phone as a remote control to change symbols.
While stepping between symbols in your software, you can have finance sites automatically change on your mobile device or browser. All your research stays synchronized as you jump between companies.
Watch the video to the right for an introduction.
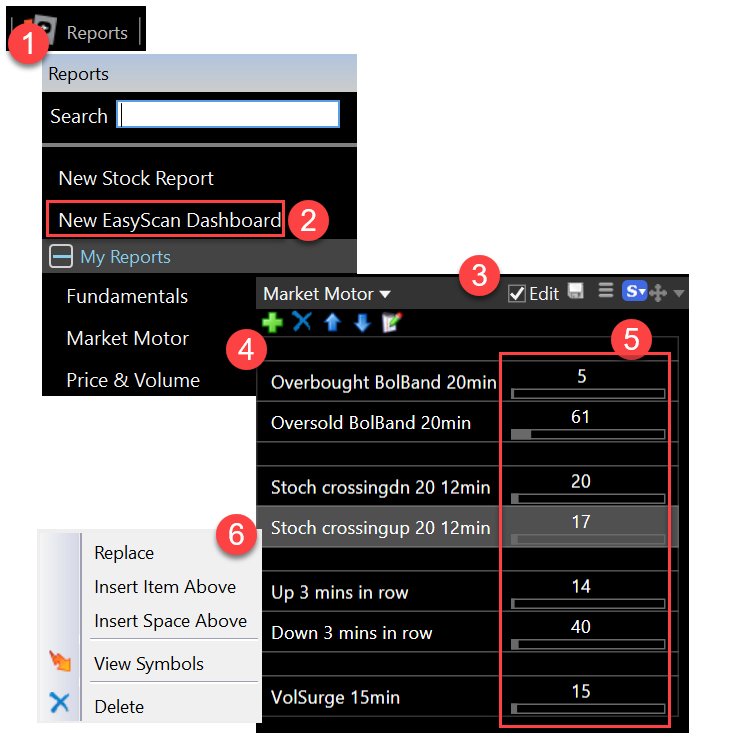
EasyScan Dashboards are reports that can track multiple EasyScans at one time. Counts are continuously updated so you can see stocks move between your scans.