From DayTradeReview.com reviews.
Charts

Scanners

Features
Ease of Use
Value

TC2000 Review is a high-end trading platform that was created by Worden Brothers. Not only has it been voted as the best analytical software under $500 for the last 24 years by Stocks & Commodities Magazine, it has pricing options to suit any investor.
TC2000 is a high-end trading platform with a focus on charting. It offers various proprietary analysis tools, screeners, and even offers trading through their own brokerage firm. Created by Worden Brothers, TC2000 has been voted as the best analytical software under $500 for the last 24 years by Stocks & Commodities Magazine. Discover more in our TC2000 review.
TC2000’s charts are endlessly customizable and extremely user friendly. While at a glance, the charts seem similar to various other charting platforms, TC2000’s charts are actually more robust than your average chart.
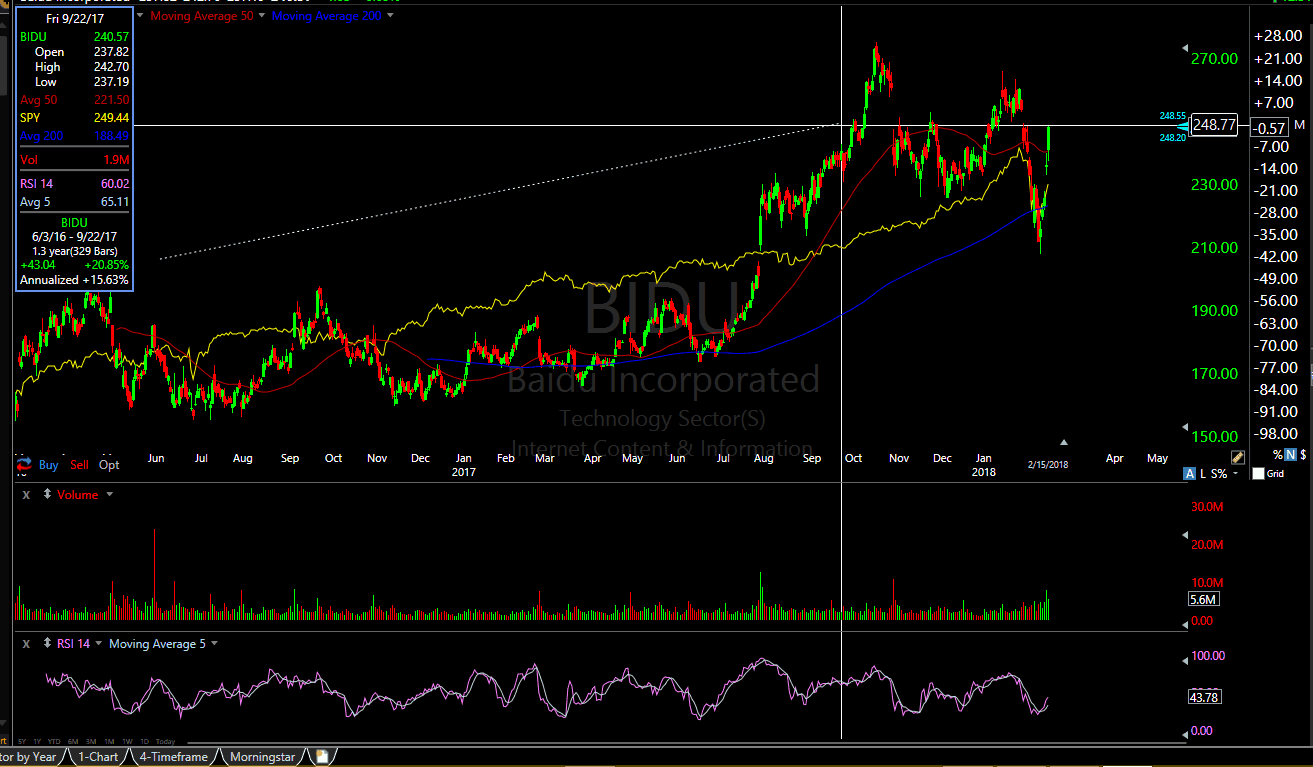
One standout feature is the data box you see in the image below. You can click your selector on any point on the chart and see the returns over time, those returns on an annualized, as well as various data points like open, high, low, close, and indicator values.
Another subtle feature that, in my opinion, drastically improves the UX is the Change Symbol screen automatically opening when you begin typing, similar to TradingView. So when you have a chart of AMZN open, and you type any letters on your keyboard, the Change Symbol window will open. This small improvement in UX really builds up over time. Having to mouse over to the symbol box every time you want to change symbols is one of the most annoying things about charting platforms.
When it comes to the zoom feature on charts, while it may not seem significant, few competitors, save for possibly TradingView match up to TC2000. The fluidity at which one can zoom in and out of charts just feels so right.
The features I am outlining in the TC2000 review may seem insignificant, but the fact is that stock charts somewhat commoditized nowadays. There are so many charting free, real-time charting platforms out there, whether they’re an independent company, or broker provided charts. TC2000 finds the small nuances that make a trading experience smooth, they take seemingly inconsequential features and turn them into functionality that you demand out of all platforms. If you’re not sweating the little things when it comes to charting platforms, why even read a review? Get whatever is the cheapest and works for you and you’ll be happy.
Most premium charting packages have more indicators than one knows what to do with, the question is, how many of those see any use? Nowadays, it is standard for any charting package to have more than 100 indicators. How many of them can you name off the top of your head?
Shear quantity of indicators doesn’t impress me, and shouldn’t impress you. I want indicators worth using. After all, the majority of them are derivative of the same two data points: price and volume, how different can they really be?
Relative strength is, by a large margin, my favorite indicator. It is one of the few indicators that isn’t an arbitrary formula of OHLC data. It simply compares one security’s performance to another. It’s an indicator that is lacking from many charting packages. But it’s mere inclusion in TC2000 isn’t my reason for praise, but their execution of the indicator.
See in the image below, how the main stock indexes are presets that can be turned on and off, saving time, but the feature I love most is the checkbox for Sector/Industry symbols. On other charting platforms, this can be tricky, as industry index symbols can vary from platform to platform, forcing you to read through documentation or use the symbol search to figure it out. The checkbox mitigates all of that.
Another rarity in charting platforms, as found in our TC2000 review, this platform allows you to add formulas like (Volume/5 bar average volume * 100) and use them as indicators, or more commonly, use them to set alerts. The indicator used in the image below looks at the average volume over the last five price bars, it would be simple to set an alert above 250 (any value you find significant enough to trade).
I’m very fond of EasyScan for one reason, you can choose how the stocks that show up in your scans rank against another security or set of securities, for the criteria you are scanning. For example, in the image below, I am scanning the list of the Russell 2000 ETF from iShares, and I’m using the 30 price trend against the market. So rather than choose an arbitrary value like most scanners, I want to see the top 10% of the Russell 2000 based on their performance against all US stocks. You can keep narrowing your selection until you have a few stocks that have massively outperformed the market.
I find TC2000 to be very similar to TradingView in chart feel, with a few key differences, those being:
TC2000 is definitely the platform of choice for day traders in my opinion, outside of functionality the top brokers (although they have a brokerage firm of their own), TC2000 has everything a day trader could ask for. Specifically, the support for floating windows is huge, as many day traders use upwards of five monitors when trading. I also see EasyScan being a huge sell for momentum based day traders, the ability to narrow down the stocks doing the best (or worst) in certain criteria is important for day traders, they want to trade what is hot right now.
I don’t see TC2000 being as practical for investors, especially macro investors who like to take positions in currency pairs, cryptocurrencies, and futures, as TC2000 only supports stocks.