Gold or Platinum Required - Real Time Data Feed Required
Pre-market mode turns on streaming data before the market opens in the morning. Toggle this mode on and off in the top right corner of TC2000. When you see the "Pre-Market" label plus the clock, this means pre-market data is streaming to your charts, watchlists, scans & sorts.
While in this mode, the "Volume Buzz" watchlist column will change to "Pre Buzz." Sort by this column to see which stocks have unusual activity. It’s a great way to get a jump on your trading day and find stocks with overnight news and rumors.
IMPORTANT: Not all stocks trade in the pre-market. It can be confusing to see pre-market stocks mixed in with stocks that last traded yesterday (especially when you sort & scan). You may wish to work from the "Premarket" watchlist to make sure you are only viewing stocks with activity today. You’ll find it under the WatchLists button on the main toolbar. As new stocks trade in the morning, they will automatically by added to this watchlist. The premarket watchlist can be used for scanning & sorting.
Gold or Platinum Required - Real Time Data Feed Required
Post-market mode turns on streaming data after the market closes at 4:00pm ET. Toggle this mode on and off in the top right corner. Data is streaming when the green checkmark is on. The watchlist column "Volume Buzz" will change to "Post Buzz." Only after-hours volume will be used in the calculation for post buzz. Sorting by the column can help you identify stocks with unusual after-hour activity.
If you wish to only work with stocks that have traded after 4:00pm, use the "Postmarket" watchlist.
Platinum Required
Scan plots show how many stocks pass your scan historically. They can make for good market timing indicators and are useful for checking if your scan conditions are too strict or loose. Counting stocks that pass conditions to create market indicators is not new. They are typically called market breadth indicators. The advance/decline line is simply a count of how many stocks are up versus how many are down for the day.
Now with Platinum, you can create custom historical counts on any watchlist, any conditions, any timeframes. Even simple conditions make for interesting graphs.
Below is an example of a scan plot for RSI is less than 25. The condition is counted against the HighCap 1000 watchlist. This in theory would count how many stocks are oversold, or at least pulling back. The scan plot appears to surge each time the SPY daily chart pulls back giving you a good feel of how many stocks are ebbing and flowing with each swing.
You can create a scan plot from anywhere you see this button  . You’ll find them under the EasyScan button on the main toolbar, in EasyScan watchlists or condition editor dialogs.
Below is another example of a scan plot that simply counts how many stocks in the S&P 500 are higher than they were 26 weeks earlier. It is plotted on a weekly chart. Back in 2008/2009, almost no stocks were up over the previous 26 weeks. The chart is updated through mid-April 2020 and shows 99 out of the S&P 500 are up over the last 26 weeks.
When you plot your own scans, you may be surprised what you see. It’s interesting to monitor how broad numbers of stocks behave in various market conditions.
Tip: A quick way to add a new scan plot to a chart is to press the "/" key or hit the "+" button at the top of the chart to add a plot. Type "scan" and select "scan plot". After it’s added, you can click on it to edit.
Platinum Required
You can think of a scan plot summary as an abbreviated view of a full scan plot. It’s nice because it doesn’t use up space on your chart and it’s a quick way to:
Historically test your conditions on-the-fly.
See how your scan is performing now versus how it normally performs.
Let’s take a look at an example using the same scan condition as above. This summary is historically measuring how many stocks in the S&P 500 are higher than they were 26 weeks earlier. The scale is set to show % of stocks passing instead of count of stocks passing. The red line shows 20% of stocks are higher right now (mid-April 2020) than they were 26 weeks ago.
The horizontal lines on the graph summarize how many stocks were typically returned by this scan. The graph is widest between the values of 55 and 85. That means that historically 55% to 85% of stocks usually pass this scan. It is rare for only 20% of stocks to be passing this scan as represented by the narrow part of the graph. That’s where we are now as of mid-April 2020, represented by the red line.
Scan plots and summaries can historically test millions of conditions for any watchlist and timeframe in several seconds. The lookback period for testing is 1500 bars. This applies to whatever timeframe you are testing. At the bottom of the summary is the pass rate of the entire test, in this case 64.1%
When you leave a scan plot or summary open (visible) in your layout, it will dynamically calculate and update in real-time (if you have real-time service). All timeframes are supported including intraday. A maximum of 15 scan plots and auto-refreshing scans may be open at any one time.
Platinum Required
You’ve probably asked the question by now, "If I can see how many stocks passed a scan at any point in time, why can’t I see the stocks that passed the scan? Of course you can, it would be silly if you couldn’t. Here’s how you do it.
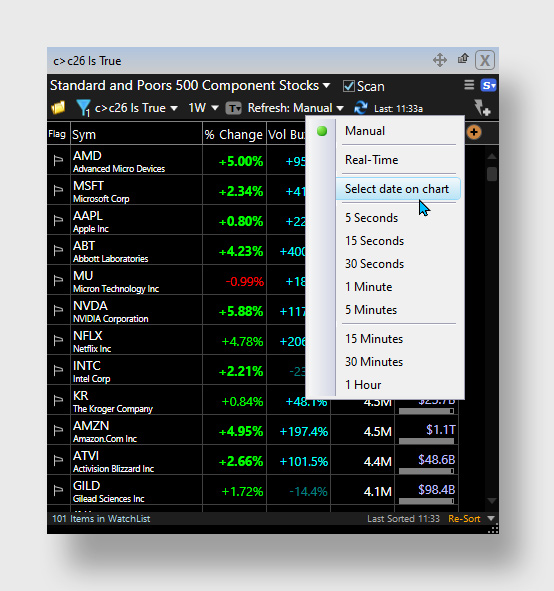
Click the "Refresh" pulldown on any EasyScan. Choose "Select date on chart". Click anywhere on a chart to see the stocks that passed at that point in time.
The example below shows the scan results for RSI<25 on October 2, 2019 when 380 stocks were passing out of the HighCap 1000.
The example below shows scan results for stocks that were higher than 26 weeks earlier as of March 6, 2009. Only 7 of 500 stocks were passing on that date. Each time you move the pointer on the chart, the scan will automatically recalculate.
Platinum Required
In the previous example, you probably noticed the scan refresh pulldown is a new feature as well. You can select how often you would like the scan to refresh its current results. Refresh interval choices range from Real-Time to Hourly.
Click the "Refresh" pulldown on any EasyScan. Choose "Select date on chart". Click anywhere on a chart to see the stocks that passed at that point in time.
Gold or Platinum Required
Flex conditions are cool, stupid-simple and they accomplish something that cannot be done with conventional conditions. We are excited to introduce this new concept in TC2000 version 20. Here’s an easy way to think of the difference between conventional and flex conditions.
Conventional conditions must pass at specific points in time, making them "rigid".
Flex conditions can pass within a window of time, making them "flexible". Also, flex conditions can be set to pass in a specific order through this window of time, which we call the "flex period".
Here’s an example of how you might apply a flex condition. Let’s say you want to find stocks that meet these conditions:
Make a new 250 day high
Pullback below 40 day moving average
Make another 250 day new high
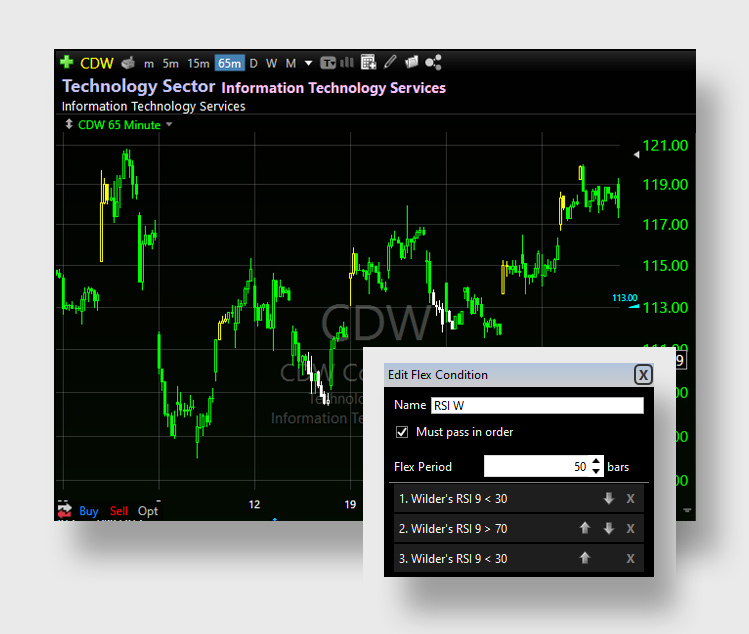
With conventional conditions, you’d have to choose specific points in time for each of the three conditions. If you combine the three conditions into a flex condition, they can pass at any time within the flex period. In the example below, the flex period is set to 30 days.
IMPORTANT: Do not confuse a flex condition as being a condition set. Remember that a flex condition is ultimately a "single" condition. At first this may not make sense since it is made up of multiple conditions. You can think of these multiple conditions as making up a single "pattern" within a window of time.
Here's an example of how the structure of a condition set would look:
Condition Set
Single Condition: Volume is above 40-day moving average
Flex Condition: Price is making double new high within 30-day period
Price is making a new high
Price is below 40-day moving average
Price is making a new high
Single Condition: Market Cap > 10,000,000
Single Condition: Percent Shares Held by Insiders > 10
The flex condition is just like the other "single" conditions in the set even though it is made up of three conditions. Those three conditions make up a single pattern of "double new high".
To create a new flex condition, click Add Condition while in an editor and choose New Flex Condition. You may add as many flex conditions as you’d like to a condition set. Saving a flex condition will add it to your library just like saving any other condition.
Note: The last condition of a flex condition must always be passing on the last bar of the flex period to be true.
Silver, Gold or Platinum Required
Click and drag on a chart, press the spacebar before lifting up on the mouse button. You’ll get a menu of drawing tools. As you hover over each, it will give you a preview of the drawing on your chart. Select a drawing to apply to the chart. Use CTRL-Click if you wish to apply a drawing to all symbols between the two points of time.
The two top choices on the menu let you instantly zoom in to that part of the chart, or sort a watchlist of stocks based on the selected period of time.
TIP: After hitting spacebar to bring up the menu, hit spacebar again to repeat the last function you used.
For drawings that are placed on a specific bar on the chart, click and press spacebar to open the menu.
Gold or Platinum Required
Timeframes no longer need to be saved with conditions. They can be, but it’s not necessary and by default they are not. There are many advantages:
You don’t have to decide the timeframe of a condition when you design it. If you want to use the condition on three different timeframes, you don’t need to save three versions of it. Just save it once.
You apply timeframes to conditions at the time you use them, just like the timeframe picker on your charts.
This makes it convenient to switch timeframes on your scans without having to open and edit your conditions every time. If you have five conditions in your scan, all five time frames can be changed with just a couple clicks.
Timeframes can now be linked between scans and charts so your scan results automatically match your charts.
By default, conditions are saved without timeframes. If you wish to keep hard timeframes on your conditions, check the box "Use mixed timeframes". This will allow you to save a specific timeframe for each condition in a set.
Gold or Platinum Required
This feature alone will save you hours. Notice that scans now have a timeframe picker and timeframe link color. The example below is scanning for stocks that are above their Bollinger band top channel. If you set the timeframe link color on the watchlist and chart to the same color (orange in this case), the timeframes will stay synced between your scan results and chart. As you switch timeframes on your chart, the scan results will always match.
If you change your chart to weekly, the scan will automatically refresh and show charts crossing up through the weekly channel top.
Gold or Platinum Required
You can add colors to any plots based on conditions. The example below colors the price white when RSI 9 makes a double bottom within a 50 bar flex period. Please use this only as an example to help you develop your own ideas. Do not make investment decisions based on it. The yellow prices show when price is above a 20 period Bollinger Band®. Coloring prices helps quickly identify when your conditions passed historically on a chart.
Here’s how to do it. Right click on a plot’s label. Choose Edit. Conditional colors can be applied to price plots and indicator plots.
In the lower section of the edit dialog, click on "Add Color". You will have the option create a new condition or open one from the library.
Silver, Gold or Platinum Required
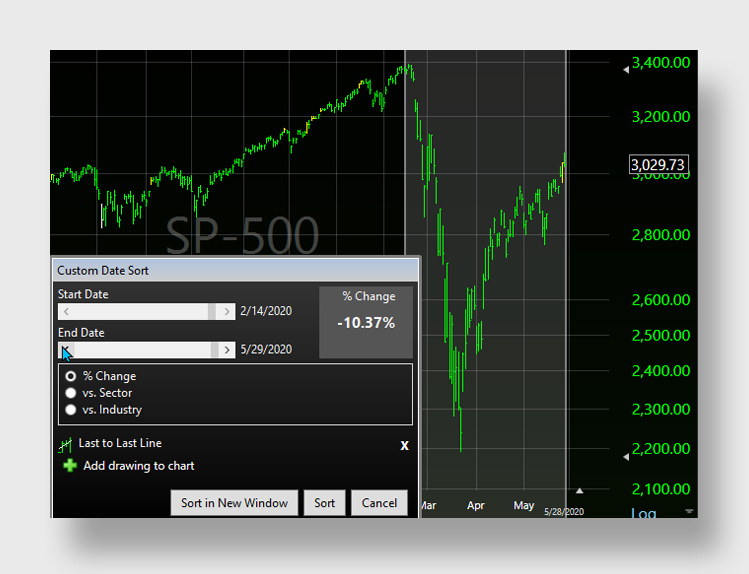
The Custom Date Sort tool makes it convenient to instantly sort a watchlist between any two days. In the example to the left, we dragged a line from the S&P 500 top in February to the current high made in May. We added a drawing tool "Last to Last Line." This line will appear on every stock as you flip through the charts making it easy to identify the window of time and the movement of each stock over it. Click the sort button and you have your watchlist sorted between the two points in time.
TIP: For more meaningful results, choose periods of time between bottoms or tops on the chart. If you only choose a single uptrend or downtrend, high volatility stocks are more likely to dominate the results.
Gold or Platinum Required
Condition editors now have a copy button. When you click it, all conditions are copied to the clipboard. A paste button will appear to show you that conditions are available in the clipboard. This is a handy tool to duplicate conditions within an editor or to paste conditions into the editor of another scan, scan plot, alert, etc.
Gold or Platinum Required
Workflows for multi-window and multi-monitor support have been improved and streamlined. It’s easy to move individual tool windows as well as entire layouts between windows and monitors. Move buttons have always been available on individual tool windows. Now they are also available in the upper right of each layout. Choosing "move" will let you move an item within a layout or to another layout window. Choosing "float" will put the item into its own new layout window.
Choose File | Save Workspace to save your entire layout of all windows
Silver, Gold or Platinum Required
Click the move icon in the upper right of any tool window and choose Duplicate. This will make an instant copy of any watchlist, scan, chart or even an entire layout. This is handy when you want to create a new item starting from an existing item. It’s also nice when you want to experiment without worrying about breaking the original item.
Silver, Gold or Platinum Required
From the same move menu described above, click on Share. You can share symbol lists, watchlist windows, scans, conditions, charts, chart templates, reports, even entire layouts. You will be given the option to share directly to Facebook or Twitter or copy the link to the clipboard.
You can email the link to a friend, post on your website or post to your favorite social media feed. People with the link can import the item into their own TC2000.
You can access items that you have shared or items that you have imported. Click the "Shared Items" button in the upper right of your software.
When selecting a color from any color picker, click the "+" button to add your own custom color. The color will become available in every color picker throughout the software.
TC2000 Windows software and data servers have been meticulously optimized. You should notice a significant difference in speed and system performance. This is the best release in 25 years and it is also the lightest weight. That means it’s less demanding on your machine and more stable. Hope you enjoy the improvements. We certainly enjoyed making this new version.
After many years of looking the same, TC2000 got a facelift for 2020. New branding, new logo, new modern toolbars. Why wouldn’t you want your trading software to look as good as it performs? Don’t worry, it’s the same software, just refined and improved.