Thanks for visiting from Sunday Paper Trading

You have an active coupon for $25.00

TC2000 combines charting, stock & option screening, and trading features in an easy-to-use, polished platform. It has been recognized as an industry leader for over 25 years. Now you can try it without having to you give us your name, address or credit card.

Simply access the web platform or download the Windows desktop.

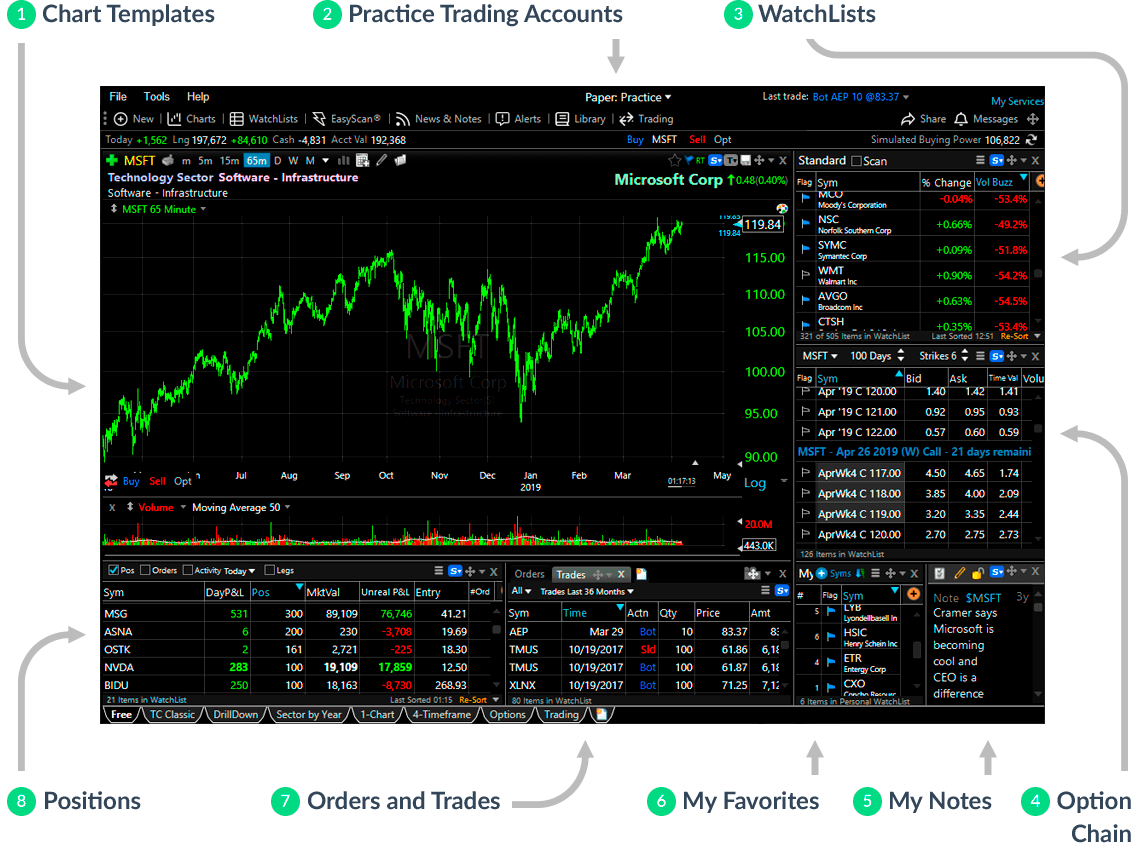
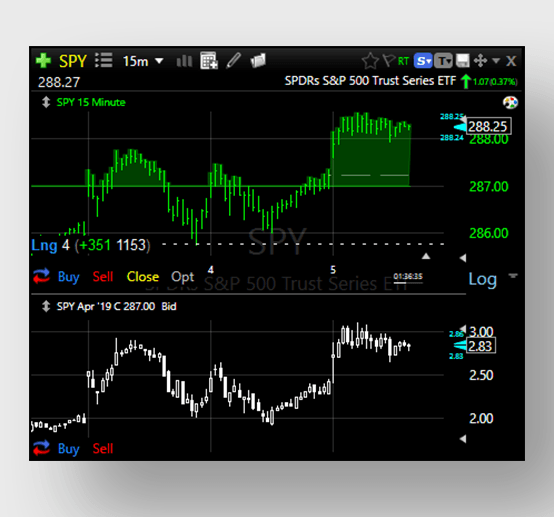
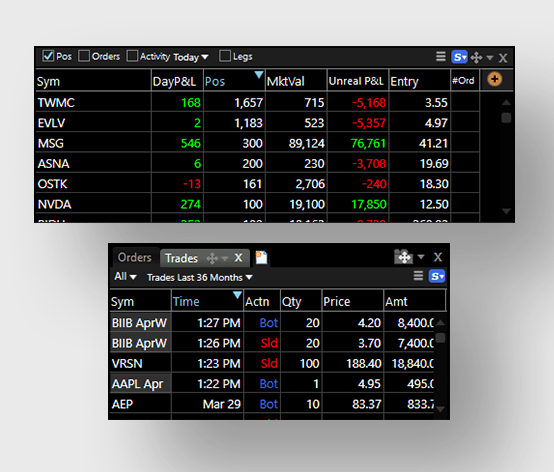
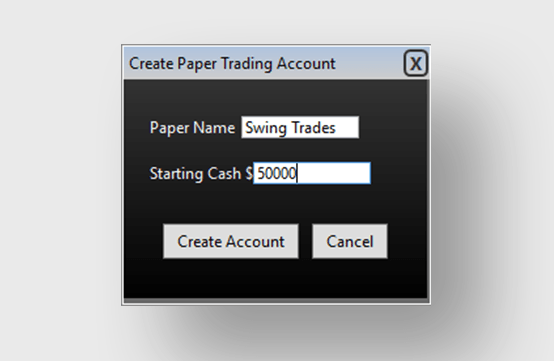
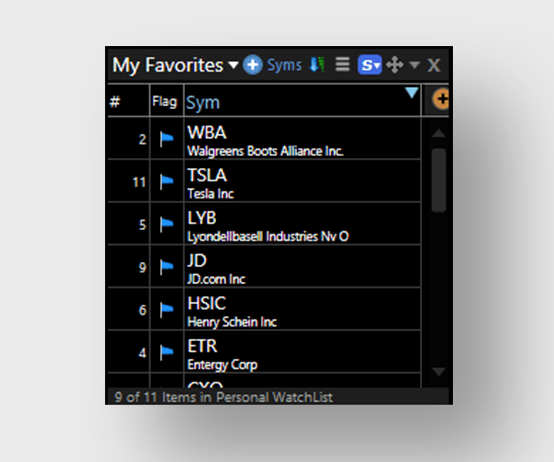
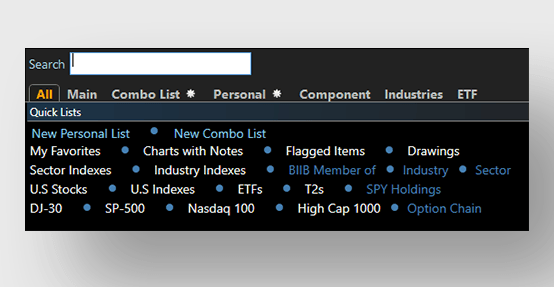
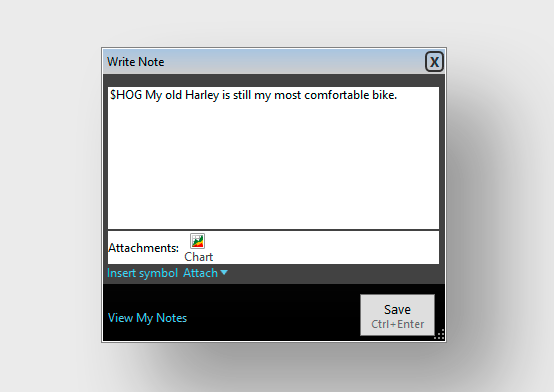
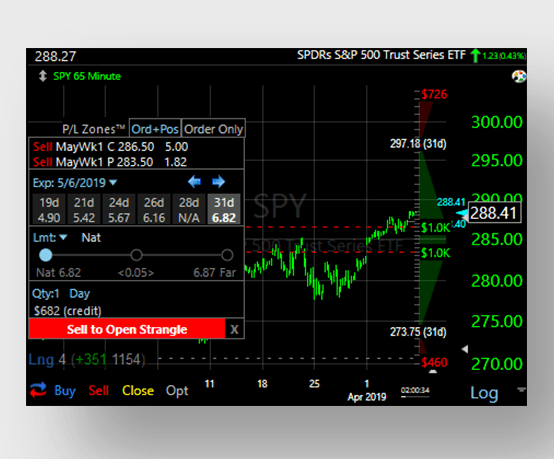
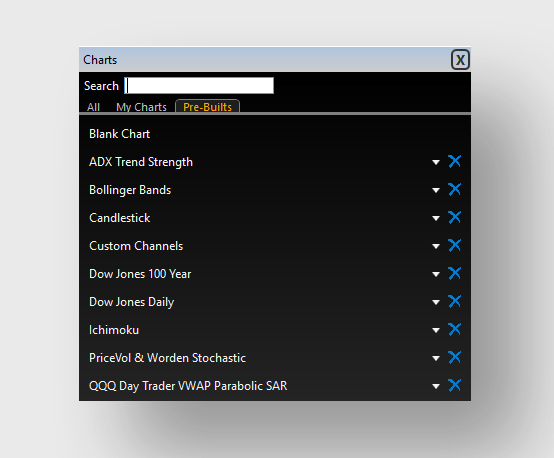
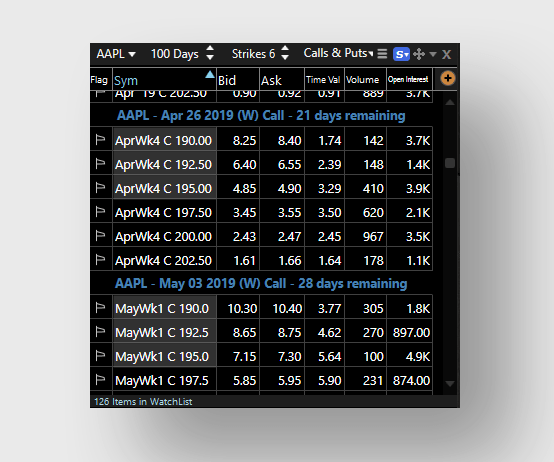
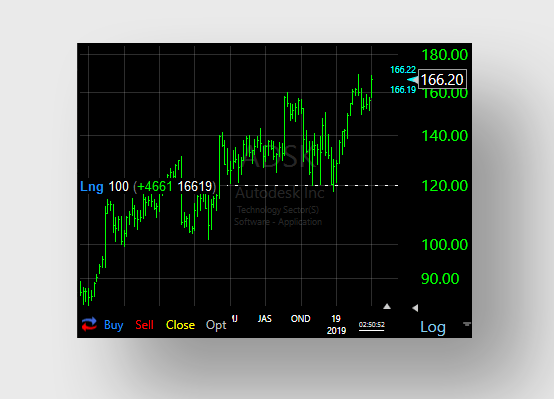
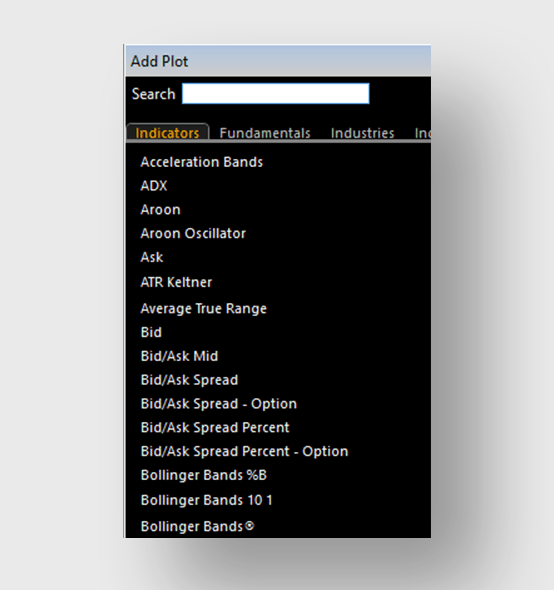
You'll get the basic layout shown below that includes stunning charts, all US stocks & options, dozens of indicators, delayed streaming data, option chains, trading windows, notepad and favorites watchlist. Play with it as much as you'd like. When you are ready, move up to Silver, Gold or Platinum and open a brokerage account.

Works on Windows, Mac, iOS, Android & Web


Stock & Option Charts

Plot option charts with the underlying stock to see the relationship between the two. Now you can plot bid/ask data or last-trade data. This makes beautiful, streaming charts for even the most thinly traded options. Notice the shading in the stock price that shows when the option is in the money.


Trading Features

Track your positions, pending orders and trades. Whether you are in a real account or in the trading simulator, you get access to stock & option strategies. You can place limit orders, bracket orders with profit targets & stops, OCA's, multi-leg orders and more.


Practice, Practice, Practice

Create unlimited paper accounts to test your ideas and strategies. There's no better way to learn without risking a penny of real money.


Stay Organized

Drag-and-drop symbols to your Favorites Watchlist. Manually rearrange to keep your most important items at the top. Have a plan, stay organized and follow it.


Market Index Watchlists

Access dozens of market index watchlists including the SP-500, Nasdaq 100, High Cap 1000, NYSE, Biotechs, Gold & Silver, Airlines, Oil, Financials, TSX and more. Please note that Dow Jones, sector indexes and some other indexes may require an additional subscription.


Keep a Journal

When something catches your attention or you want to remember something specific about a stock, write a note to make sure it doesn't fall through the cracks. Journaling is a great way to improve your own personal trading habits. Charts are automatically saved with your notes for quick reference when reading in the future.


Trade Multi-Leg Strategies from the Chart

This patent-pending tool makes it easy to visually understand option strategies. The P&L zones on the right side show profit, loss and breakeven levels for the stock at expiration. In this example, you want the stock to go side-ways. The green zone represents a profit of up to $1000. The breakeven levels are $297.18 and $273.75. The red zones show unlimited loss to the up and downside. As you slide the strike price lines on the chart and move through expiration dates, the P&L zones are updated dynamically making it easy to see the impact on risk/reward.


Built-in Option Strategies

Pick a strategy based on the picture. The green represents where you think the stock is going to go. Red represents where you would lose. Click the strategy to have the legs automatically overlaid on the chart. Then drag the lines to move between strike prices and expiration dates. This patent-pending tool is a great way to learn how multi-leg option strategies work.


Place Multiple Exit Orders on Positions

Sometimes you have more than one reason to close out a position. You might have three or more reasons. Maybe you want to get out if a stock crosses an indicator, or you hit a profit target or maximum stop loss line. You can place as many exit orders as you'd like. When one of them executes, TC2000 will cancel the remaining orders automatically.


Draw on Your Charts

Draw trendlines to help you identify trends and patterns. Measure swing sizes and write notes directly on the chart that are automatically saved for the next time you return.


Place Limit Orders on the Chart

Drag limit & stop orders to visually place orders at specific prices.


Chart Library

Customize and save charts to your own library.


Built-In Option Chains

Access over 100,000 option contracts. Narrow down chains by calls, puts, number of strikes and time to expiration.


Visually See Positions

Long, short and option positions are displayed on the chart for a quick reference of gains and losses.


Lots of Indicators

Plot from a large library of indicators. You can even plot indicators of indicators. Some indicators may require a higher level of service.