What's New in Version 19
Software available to download here - Visit the TC2000 YouTube channel
Software available to download here - Visit the TC2000 YouTube channel
TC2000 version 19 now gives you more visible price and indicator history in each time frame. Just use the scroll wheel on your mouse or the zoom & pan bar at the bottom of the chart to see up to 1500 bars of data. That equates to: 6 years on daily charts, 1 year on hourly charts, 4 days on minute charts.

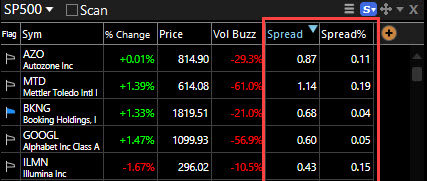
Now you can plot the Bid/Ask spread as an indicator to see a history of the Bid/Ask action of any stock or option. Or simply add a column and sort to find the stocks in your WatchList with the largest or smallest spread. Use either the actual spread, the mid-point between the Bid and Ask or view the spread as a percent of the price of the stock or option. (All Bid/Ask/Mid spread plots, indicators, columns, etc., require the additional Real-time US Stock data feed for stocks and Real-time US Options data feed for Options.)

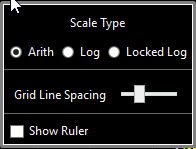
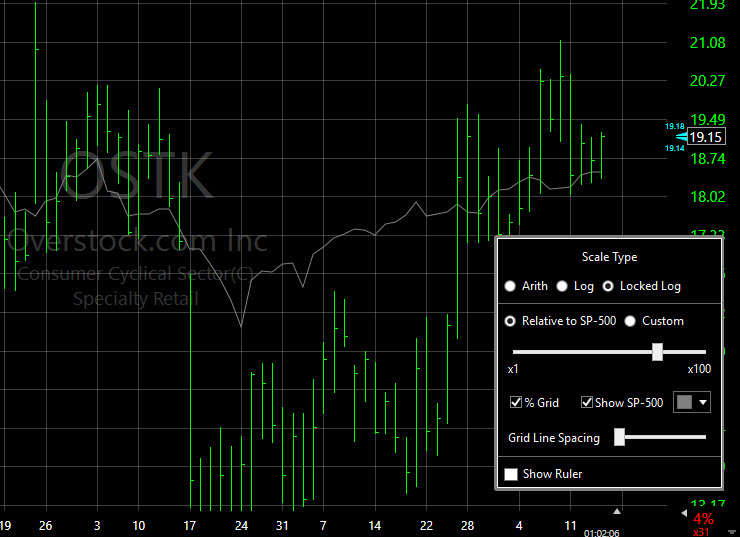
The new streamlined scaling menu allows you to quickly move between scaling modes.
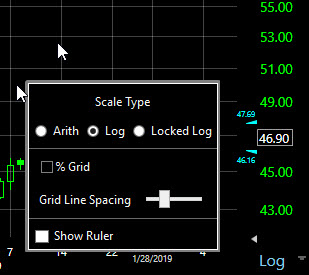
Using standard log mode gives you round numbers, but the gridlines are not equally spaced.
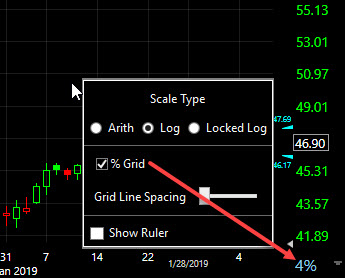
Using %Grid (an alternate grid display preference) gives you equal space between grid lines (by percentage) but does not give you round numbers in the scale.
Note: Use the slider in the Scale Type menu or hover the mouse over the scale and use the Mouse Scroll Wheel to increase/decrease the number of gridlines in either Arithmetic or Standard Log scale.
Relative to SP-500: This scale method allows you to see the volatility (movement) of your stock directly compared to the volatility of the SP-500. The x factor (slider) is used to determine the comparison. (For example: choose 100x for the S&P) plot to fill 100% of the window; 1x means the SP-500 takes up 1% of the window.) Move the slider back and forth to expand/contract the window. If a stock is very volatile compared to the SP-500, some or much of its price history can actually go off the top/bottom of the chart (see below) at 100x. As you move from chart to chart, you get a much better picture of how the volatility of the stock you are viewing compares to the broader market (SP-500).
Using %Grid (an alternate grid display preference) gives you equal space between grid lines (by percentage) but does not give you round numbers in the scale.
Custom allows you to set a custom locked scale. Choose the % you want between gridlines and the number of gridlines you want to show on the chart. (You can do this in each time frame you use). These scale and gridline selections remain constant as you move from stock to stock (e.g. you always know any stock you look at has X% between gridlines).
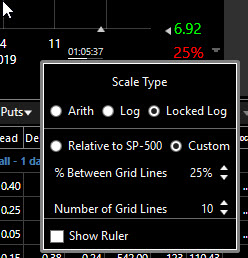
In Locked Log scale mode, use the slider in the Scale Type menu or the shortcut combination Alt + Mouse Scroll wheel to increase/decrease the multiplier factor or custom percent value.
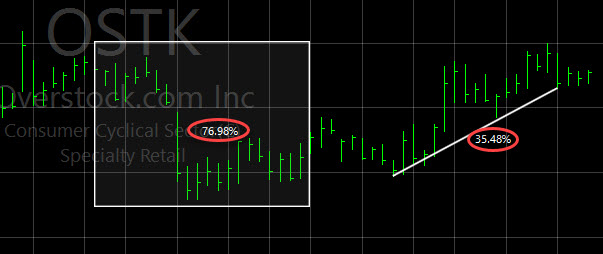
You can now choose to display a percentage (percent difference between start and end of line) whenever you draw a trendline or use a rectangle drawing tool. These tools can help with simple things like measured moves or percent differences between points on the chart.
Option price history can now be plotted on your chart based on the bid, ask, mid* or last price. This allows you to see the action of the buyers and sellers even if they don’t agree on a price. It posits a better picture of the true price action for the option you're viewing. (Price Bid, Ask and Mid* can also be plotted as separate indicators if desired.)

Option indicators and columns can also be calculated from bid, ask, mid* or last data. And the new option indicators can be used for scanning & sorting by bid, ask, mid* or last.

A number of new option criteria have been added. Use these for columns in your option chains to put key data at your fingertips. Use the Add Column button (orange plus sign) to add any of these criteria and then simply click on the column header to sort an entire option chain by the column data.

Option chart behavior has been improved in version 19. Here are a few ways: The underlying stock is now shaded when option is in-the-money (above the strike price for calls; below the strike price for puts).

Technical indicators, like the Bid/Ask* Spread and Volume, can now be based on the option or underlying stock for your chart display.

Whenever you have an option chart showing and you switch to a stock chart, the software automatically hides option-based indicators that have no application to a stock chart.
You can now access TC2000 from your Mac, iPad, iPhone, Android Device or browser. This is the full software (not an App) running on our server accessible from anywhere, any device, any time. There is no extra cost and you always have access to the latest version of TC2000. Access to this service requires Parallels Client (free app) if running from outside of a browser.
Sign up at www.TC2000.com/Anywhere.
Once you’re up and running on your mobile device, you can use the tool set in Parallels client that helps you navigate your TC2000 on your device (on the right of the screen).

Click the X to close the program.
Click the gear icon to open a small suite of navigational tools (e.g. a row of shortcut keys added to the bottom of your screen; several mouse modes; allow your mobile device to adjust the resolution as you rotate the screen; etc.)
Click the keyboard icon to open a keyboard (so you can type a symbol).
Click the tab icon to switch between applications on your device.
Swipe the screen to hide/show this toolbar.
Remember: this is your full TC2000, so you can do anything with it you’ve normally done on your desktop or laptop computer.
*All Bid/Ask/Mid spread plots, indicators, columns, etc., require the additional Real-time US Stock data feed for stocks and Real-time US Options data feed for Options.